Finding Popular CAS Services with Splunk: A Complete Guide
Understanding CAS and Its Importance
Central Authentication Service (CAS) is widely used in enterprises and educational institutions to provide single sign-on (SSO) authentication. Tracking which CAS services are most frequently accessed can offer valuable insights into user behavior, application usage, and potential security concerns.
Splunk is a powerful tool that can analyze authentication logs and help identify the most popular CAS services in your organization. In this guide, we’ll explore how to extract, process, and visualize CAS service data using Splunk.
This post contains affiliate links, which means I may receive a small commission, at no extra cost to you, if you make a purchase using these links.
Why Track CAS Service Usage?
Before diving into the technical details, it’s worth understanding why tracking CAS service popularity is valuable:
- Security Monitoring: Identifying high-traffic CAS services can help detect anomalies and potential security threats.
- Application Insights: Understanding which services are most used helps IT teams optimize infrastructure.
- Compliance & Auditing: Many organizations need to track authentication patterns for compliance reasons.
Setting Up Splunk for CAS Log Analysis
To start analyzing CAS authentication logs in Splunk, ensure your Splunk instance is properly configured to ingest logs from your CAS server. If you haven’t set up CAS logging with Splunk, check out my previous guide.
Once logging is enabled, we need to extract the service URL field for analysis.
Creating a Field Extraction for service_url
Splunk requires a field extraction for service_url to properly categorize authentication events. Here’s how to define it:
- Go to Settings → Fields → Field Extractions.
- Create a new field extraction for
service_urlusing the appropriate regex pattern. - Use the following query to verify data extraction:
index=authentication service_ticket_created | table _time, user, service_url
This will display authentication events along with the associated service_url field.
Identifying Popular CAS Services in Splunk
Once we have our logs, we can identify the most frequently used CAS services.
Basic Query: Finding the Top CAS Services
A simple query to find the most accessed CAS services:
index=authentication service_ticket_created | top limit=40 service_url
However, this query might return duplicate entries due to differences in GET parameters.
Refining the Query: Removing GET Parameters
Many CAS service URLs include GET parameters (e.g., ?id=123). These can cause duplicate entries in our results. To clean up the data, we can use a regular expression to strip out everything after the ? in URLs:
index=authentication service_ticket_created
| rex field=service_url "^(?<stripped_url>.+?)\?"
| top limit=40 stripped_url
Handling URLs Without Query Parameters
The above regex removes URLs that don’t contain ?. To avoid this issue, we use an eval statement to retain the original URL when necessary:
index=authentication service_ticket_created
| rex field=service_url "^(?<stripped_url>.+?)\?"
| eval url=if(isnull(stripped_url), service_url, stripped_url)
| top limit=40 url
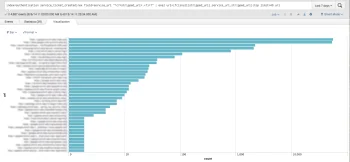
Visualizing CAS Service Popularity
Splunk’s visualization tools allow us to represent our findings graphically. After running our query, switch to the Visualization tab and select a Bar Chart or Pie Chart for an easy-to-read breakdown of CAS service popularity.
Adjusting Scale for Better Insights
If there’s a large variance between different CAS services, consider switching the graph’s scale to logarithmic to better represent differences in usage patterns.
Answering Common Questions About CAS & Splunk
How Can I Detect Anomalies in CAS Authentication Logs?
To identify unusual spikes in service usage, use Splunk’s timechart function:
index=authentication service_ticket_created
| timechart span=1h count by service_url
This helps spot irregular login activity, potentially indicating security threats.
How Often Should I Review CAS Service Logs?
For security and operational insights, schedule a weekly or monthly Splunk dashboard review. Automated alerts can also notify you of unusual authentication patterns.
What Are the Best Splunk Dashboards for Authentication Monitoring?
- Top Accessed Services Dashboard: Displays the most popular CAS services.
- Anomaly Detection Dashboard: Highlights unusual login spikes.
- User Authentication Trends: Tracks login patterns by time of day/week.
Taking Your Splunk Skills Further
Mastering log analysis can significantly enhance your organization’s security posture. If you’re interested in improving your Splunk expertise, check out this highly-rated course:
Splunk: Zero to Power User by Hailie Shaw.
Conclusion: Unlocking Valuable Insights with Splunk
Tracking CAS authentication logs in Splunk provides crucial insights into service usage, security risks, and user behavior. By refining your queries and leveraging visualization tools, you can enhance your IT monitoring and optimize authentication processes.
With free training resources and Splunk’s powerful analytics, there’s never been a better time to improve your log analysis skills!
Note: This post updates our original article from 2014, reflecting modern log analysis techniques and Splunk best practices as of 2025.